Data Science Blogging with Pelican

Data Science

I've been blogging on Wordpress since 2007, but very infrequently, maybe somewhat due to the workflow and platform. For many years now, most of the interesting content I create is in Jupyter notebooks (certainly the more relevant content to my work these days). I wanted a way to integrate this content into my blog, but realized that not all of the legacy content has aged well and a notebook workflow using the current setup would likely be cumbersome.

I've used nbviewer to make web accessible versions of notebooks in the past, for example:

more ...

Intro to Python for Financial Market Data

Most finance websites show quotes or charts for various financial markets. Where is this data freely available and how can we download it, wrangle it into a useable format, and visualize it ourselves?

A quote for a financial instrument like a stock, currency, or commodity is a snapshot in time reflecting the sum of individual trades happening on the market for this instrument. Data points like price or trading volume are collected periodically to form a historical time series. If we chart this time series, we can visualize the activity of individual instruments, or the market as a whole with an index, and gain a quick overview, and perhaps some insights into the data.

more ...

Visualizing Bitcoin OTC Trust Networks

Below is a who-trusts-whom network of people who trade using Bitcoin on a platform called Bitcoin OTC. Since Bitcoin users are anonymous, there is a need to maintain a record of users' reputation to prevent transactions with fraudulent and risky users. Members of Bitcoin OTC rate other members in a scale of -10 (total distrust) to +10 (total trust) in steps of 1.

Let's see if we can produce some meaningful insights by visualizing a snapshot of the network.

Dataset statistics

  • Nodes 5,881
  • Edges 35,592
  • Range of edge weight -10 to +10
  • Percentage of positive edges 89%

Sampling

One month sample is used with a broad range of ratings.

more ...

Visualizing Historical Bitcoin Prices

This notebook explores visualizing historical price data for Bitcoin. A colorized candlestick chart helps visualize daily price trends and larger time frame price trends together: https://en.wikipedia.org/wiki/Candlestick_chart

Fetching Historical Price Data

Candlestick Chart

Use matplotlib and mpl finance library for candlestick support: https://github.com/matplotlib/mpl_finance

Chart shows:

  • Bitcoin prices organized by day (in UTC)
  • X-axis is Date
  • Y-axis is Price at Open, High, Low, and Close of the day

Interpretation

  • Color:
    • Green candlesticks are "bullish" trend days (increased price)
    • Red candlesticks are "bearish" trend days (decreased price)
  • Body: Difference between open and close, day's trend strengh
  • Shadows: Day's price range, high above open/close, low below open/close
  • more ...

Interviewed for The Striker Report


Finance

I was interviewed for the February issue of the Striker Report.

Developer/CTA Interview

Chris Degiere, Founder of Trading Technicians

  • Program(s) Developed: Evolution Gold Trading System
  • Interview Date: February, 2014
  • Interviewed by John F. Gallwas, Founder of Striker Securities, Inc.

Chris Degiere is the founder and principal of Trading Technicians, a Silicon Valley company that develops and markets futures trading systems. Chris is a software engineer and consultant with more than 17 years of experience in the technology and financial industries and has been an active trader and system developer since 2007.

John Gallwas: Tell us a little about …

more ...

Using a Trade-assist Broker for Automated Trading Systems

Trade Assist Broker

What is autotrading or broker assist trading?

Trading Technicians develops automated trading systems for commodity futures trading.

Investors seeking diversification and exposure to short-term quantitative trading in commodities can have a trade-assist broker execute our automated trading systems for you.

You grant discretion to the assisting futures broker and they execute trading signals generated by our automated trading systems directly in your account.

What are the benefits of using a trade-assist broker?

Even fully automated trading systems require dedicated time and supervision during market hours. Many investors do not have the time to make sure every trading signal is followed …

more ...

Hello World!

Here's some basic python code to test pelican themes and code styling:

# a comment
def say_hello(name):
    print(f'Hello {name}!')

if __name__ == "__main__":
    say_hello('Chris')  
more ...

Traffic Metrics and 5 Source Code Search Sites

Competitive research and traffic analysis is an important part of launching a new site or web app.

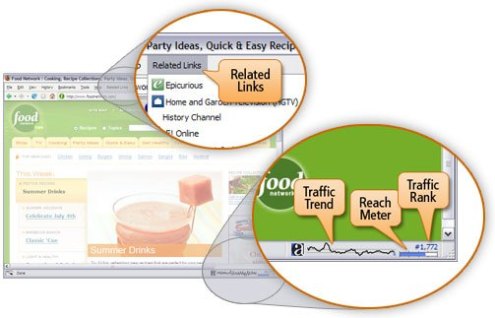
Alexa Toolbar

I did a quick study that uses source code search sites as the subject for comparison. Here I highlight some key metrics from these two Firefox add-ons:

I found these sites through my delicious bookmarks, search, and the "Similar Pages" and "Related Links" features of both of the above add-ons

Source Code Search Site Alexa Traffic Rank CoolGoogle PageRanke
Google.com/codesearch 2 7
Koders.com 34642 6
Krugle.com 113268 5
Codefetch.com 175389 4
Codease.com …
more ...